Click headlines to expand
General information
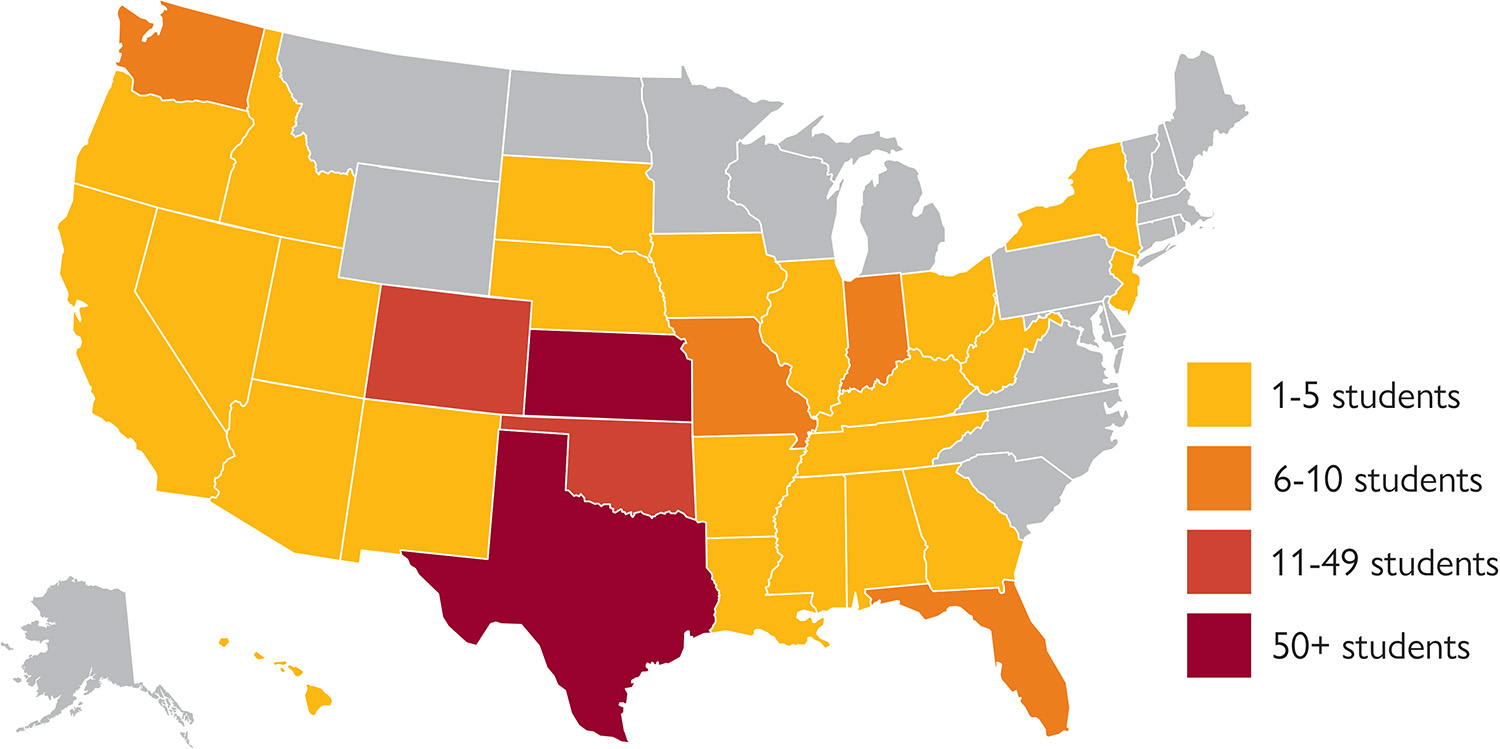
Hesston Students/Student Profile (Fall 2024)
Home countries of International students
| Albania |
5
|
Italy |
3
|
||
| Australia |
1
|
Japan |
15
|
||
| Bahamas |
4
|
Lithuania |
1
|
||
| Bangladesh |
1
|
Myanmar |
1
|
||
| Botswana |
1
|
Peru |
1
|
||
| Cayman Islands | 1 | South Africa |
3
|
||
| Colombia |
2
|
Spain |
4
|
||
| Dominican Republic |
1
|
Sri Lanka |
1
|
||
| Eswatini |
1
|
St. Vincent and the Grenadines |
1
|
||
| Ethiopia |
2
|
Sweden |
1
|
||
| Honduras |
2
|
United Kingdom |
4
|
||
| India |
1
|
Vietnam |
2
|
||
| Indonesia |
2
|
Zimbabwe |
1
|
Other statistics
| Total Enrollment: |
372 students
|
|
| Kansas: |
34.4%
|
|
| Other U.S. states and territories: |
48.9%
|
|
| International: |
16.7%
|
|
| Mennonite Students: |
6.7%
|
|
| American Indian or Alaska Native Students: |
1.3%
|
|
| Asian Students: |
1.9%
|
|
| Black or African American Students: |
8.9%
|
|
| Hispanic Students: |
20.7%
|
|
| Native Hawaiian or Other Pacific Islander Students: |
0.3%
|
|
| Nonresident Alien Students: |
17.2%
|
|
| Other Students: |
0.8%
|
|
| Two or More Races: |
5.1%
|
|
| White Students: |
43.8%
|
|
| Student-Faculty ratio: |
12 to 1
|
|
| On-campus (residential) students: |
84.1%
|
|
| Women: |
52%
|
|
| Men: |
48%
|
|
| Average High School GPA (new students): |
3.37
|
|
| Average ACT score (new students): |
19.1
|
|
| Average SAT score (new students): |
1000
|
Classrooms, technology, student support and academic policies
- Instructional facilities
- Student Success and support services through the ACCESS lab
- Facilities and services for students with disabilities
- Copyright infringement policies and sanctions
- Academic integrity/plagiarism policy
- Grading policy
- Computer use and file sharing policies
Costs and financial aid
Cost to attend Hesston College
Textbook costs
Financial aid resources
Code of Conduct for Hesston College Financial Aid
Textbook costs
Financial aid resources
Code of Conduct for Hesston College Financial Aid
- How to apply for financial aid/Who to contact for information or assistance
- Financial aid frequently asked questions
- Federal Work Study
- Financial aid policies – withdrawal, refund and satisfactory academic progress
- Net price calculator
- Scholarship estimator
- Sample aid packages
- Scholarships
- Loans
- Loan counseling – entrance and exit loan interview link are available on the Loans page
- Preferred lenders
- Preferred lender arrangements
- Using VA benefits at Hesston College
- Financial support for students participating in intercollegiate athletics
Loan default rate – Hesston College’s loan default rate for the 2021 three-year cohort (the most recent available cohort) is 0%
Campus life, safety and security
- Student activities
- Equity in athletics – October 2024 report
- Drug and alcohol abuse prevention program, Drug and Alcohol Policy
- Vaccination policy
- Sex Discrimination and Other Forms of Sexual Misconduct Policy – Title IX
- Campus security policy/crime awareness
- Campus crime statistics, Institutional information
- Fire safety, statistics
- Missing persons policy
Policies, procedures and notifications
Student Outcomes
- Graduation rate
- Retention rate – Retention rates for the U.S. Department of Education, as reported through IPEDS, measure the percentage of first-time, full-time students who are seeking bachelor’s degrees who return to the institution to continue their studies the following fall. The retention rate for those entering Hesston College in the fall of 2018 was 85 percent.Hesston College also measures retention rates for both the new student cohort and all students together, regardless of enrollment status or degree sought, from one fall to the following fall. The retention rates for those groups over the past three years are reported here.
Retention New Student Cohort All Students Fall 2023 to Fall 2024 63% 62.93% Fall 2022 to Fall 2023 67.4% 69.7% Fall 2021 to Fall 2022 67.4% 70.1% - Engineering enrollment and graduation data
Academic Year Program Enrollment Bachelor’s Degrees Conferred 2022-23 12 n/a 2023-24 14 n/a 2024-25 31 TBD - Nursing – NCLEX-RN pass rate
2022 2023 2024 1st time pass rate 89.47% 96.97% 94.44% All attempts (1st time and repeats) 97.37% 100% 97.22% (pending) - Nursing – BSN program completion rate
- 2022: 85.42%
- 2023: 86.11%
- 2024: 87.5% (pending)
Formula Used: Number of graduates divided by all potential graduates for a given graduating class over a 150% timeframe (excluding students who withdraw for personal reasons).
- Nursing – job placement rate
- 2022: 100% for May 2022 BSN graduates
- 2023: 100% for May 2023 BSN graduates
- 2024: 100% for May 2024 BSN graduates